Data centers will strain the grid (even with demand response)
Abstract
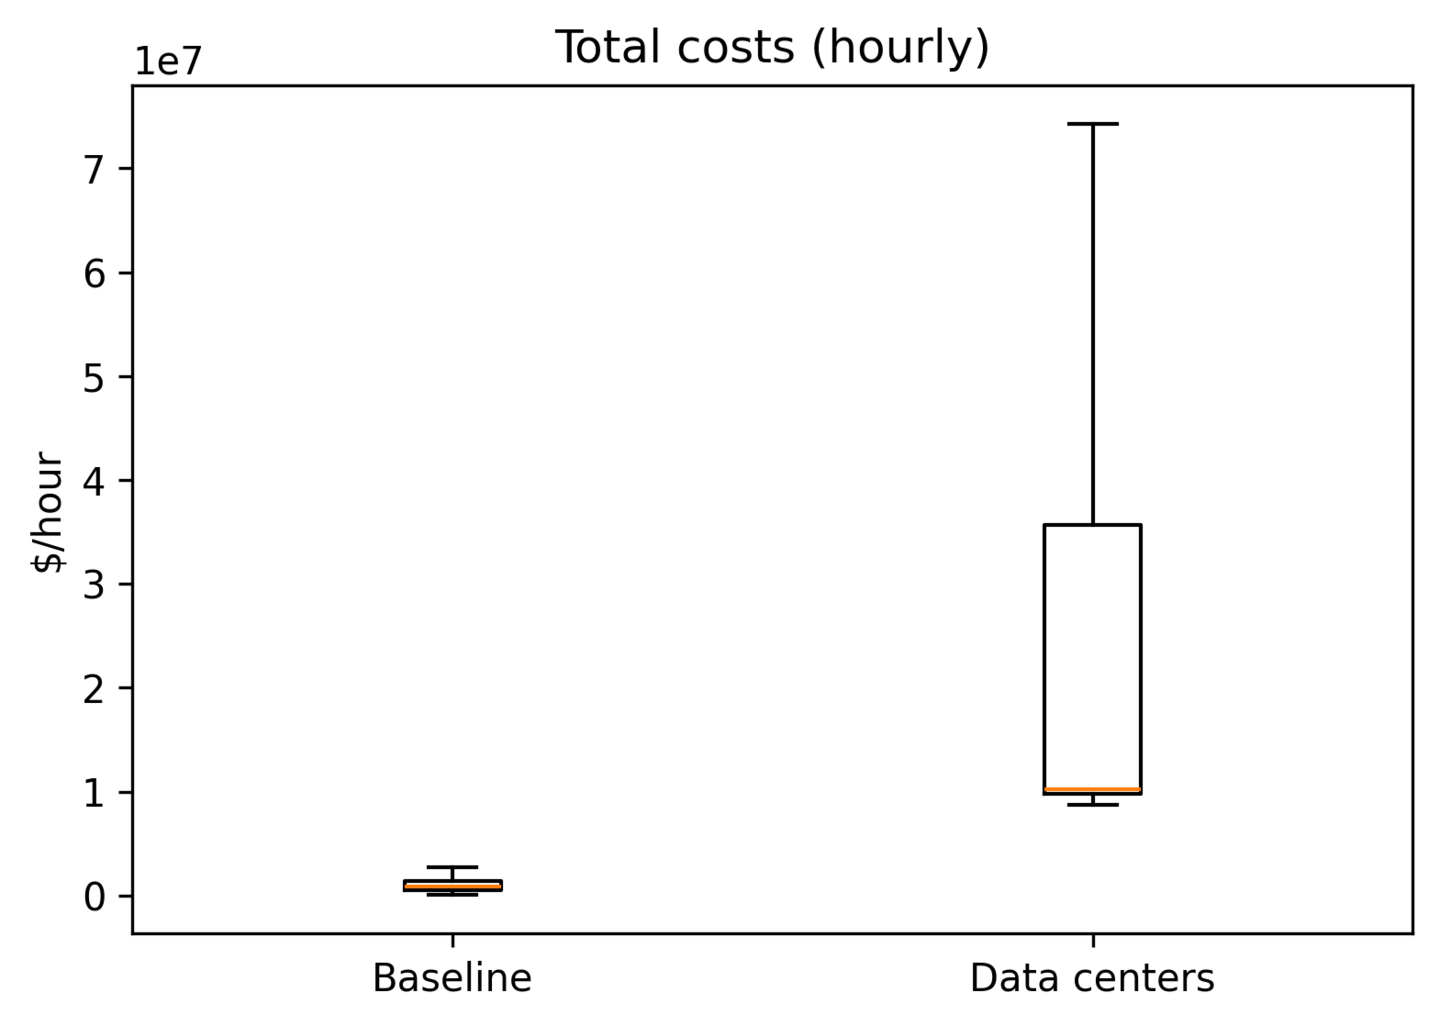
Large technology companies suddenly have a massive hunger for electricity to power their AI and cloud-computing data centers. In an April 2025 report, the Texas grid operator forecasted (opens in new tab) that data centers will demand 22 GW by 2030, up from around 1 GW today. Using power-flow grid simulation software Vatic (opens in new tab), we performed various studies about the impact of new data center loads on the Texas grid. We used a forecasted generation mix for the Texas grid in 2030 that consists of 50% of generation from renewables. By adding 22 GW of additional demand from data centers, average wholesale electricity prices rose from $21.18/MWh to $31.47/MWh, a 49% increase. Total system costs, which accounts for fixed, variable, and a load shedding penalty, increased from $1.4 million per hour to $74.5 million per hour. This dramatic increase in cost shows that without additional supply the system cannot support 22 GW of added data center load. To help facilitate data center additions, researchers and practitioners suggest the large loads should participate in demand response, the curtailment of energy demand during periods of grid stress. We implemented demand response in Vatic curtailing each data center 0.5% of the time to reduce load during peak demand hours. At this level of curtailment, demand response occurred in the system 72 hours of the year and reduced cost significantly (up to 50%) during these hours. However when considering an average over the whole year (8760 hours), demand response had a limited impact on total system costs, and they remained at a high level of $71.0 million per hour.
Introduction
With the ever-growing concern for large-scale sustainability implementation, tech companies across the board have been at the forefront of expanding and pursuing net-zero initiatives for years. Google announced (opens in new tab) going carbon-neutral almost 20 years ago, in 2007. Other giants, including Microsoft (opens in new tab), Apple (opens in new tab), and Amazon (opens in new tab) have all pledged to go carbon-neutral by the year 2040. With the recent acceleration of the Artificial Intelligence (AI) race, however, the decades-long efforts to decrease carbon emissions and embrace sustainable values may be at stake.
Data centers, which are large-scale facilities responsible for the remote storage, processing, and the distribution of large amounts of data, are growing ever more pivotal. Although data centers emerged in mid-20th century, more than 70 years ago, they have now become a major player in contributing to the rising energy demands of AI. According to the 2024 Berkeley National Lab United States Data Center Energy Usage Report (opens in new tab), “data center annual energy use remained stable between 2014–2016 at about 60 TWh, continuing a minimal growth trend observed since about 2010”. In 2017, however, a major shift occurred with the integration of Graphical Processing Units (GPUs) to support AI-driven tasks. Prior to 2017, most computer clusters in the data centers were run on Central Processing Units (CPUs), which are general-purpose processors found in most computers. While CPUs are great for performing complex sequential tasks, they lose in performance to GPUs at performing large-scale, parallel processing tasks. Over the five-year period from 2018-2023, data center energy consumption has risen tremendously (opens in new tab) from 76 TWh in 2018, representing 1.9% annual US electricity consumption, reaching 176 TWh in 2023, which is 4.4% of annual US electricity consumption by the end of 2023.
Despite already being high, the demand from data centers is projected to increase even more in the near future. As per the Berkeley National Lab report (opens in new tab), in the year 2028, data centers are projected to make up between 6.7-12.0% of the total US electricity consumption, with low and high estimates of 325 and 580 TWh, respectively. Other sources share similar estimates. Goldman Sachs estimates (opens in new tab) that data centers will consume 400 TWh and Barclays estimates (opens in new tab) that the number will be 560 TWh in the year 2030. According to Eliza Martin and Ari Peskoe of the Harvard Environmental and Energy Law program, “By 2030, data centers may consume as much as 12 percent of all U.S. electricity and could be largely responsible for quintupling the annual growth in electricity demand”.
It is impossible to predict just how much demand, percent-wise, from a particular data center, or even multiple data centers across the US, is driven by AI. Such data is simply not available. Despite this limitation, it is still possible to study the impact of AI on energy demand. As discussed in an International Energy Agency (IEA) Energy and AI report (opens in new tab), the bulk of data center growth is from AI integration.
Methodology
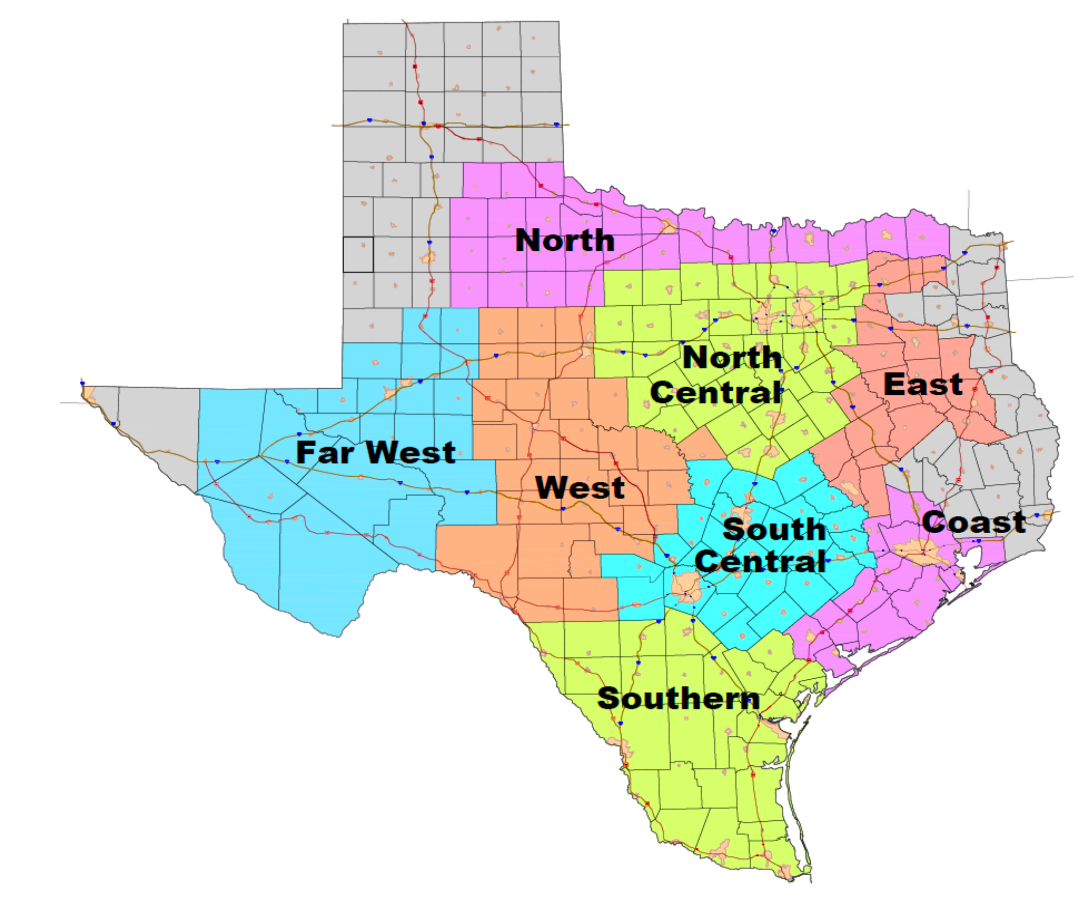
With the tools available to us, including a grid optimization software called Vatic (opens in new tab), we studied the impact of projected data center growth on a synthetic Texas grid from 2030. The grid was constructed from publicly available information by a group of researchers from Texas A&M (opens in new tab). We selected Texas as the state to conduct simulations on for a few reasons. Firstly, Texas’ grid operator, Electric Reliability Council of Texas (ERCOT), which handles around 90% of Texas electricity load, provides adjusted load forecasts which include data center expansion growth. ERCOT breaks down the adjusted loads by the following seven categories: Base No PV, Data Centers, Crypto, Industrial, Hydrogen, Oil and Gas, PV, where PV stands for photovoltaics, or in other words, solar energy that is converted to electricity. We used ERCOT’s Adjusted Load Forecast from the April 2025 Board of Directors meeting notes (opens in new tab).
Based on ERCOT’s adjusted summer peak forecast data, we obtained the value of 22.175 GW, which represents the data center load. Using 2030 forecasts, we would be able to simulate the forecasted data center demand in an open-source software Vatic, which is based on Lawrence Livermore National Lab’s grid software Prescient. The Texas A&M synthetic grid covers ERCOT’s geographic footprint and contains the generators with the fuel types of Nuclear, Wind, Coal, Solar, Natural Gas and Hydro.
Modeling the adjusted load required us to distribute the demand reasonably across the seven thousand buses. A crucial limitation to the modeling of new energy demand lies in the lack of office data center location information. However, we were able to identify 350 data centers in Texas thanks to the commercial Data Center Map website (opens in new tab), which lists data centers across the globe, providing valuable information like location, square footage, and peak power.
Next, we spread ERCOT data center load prediction across the individual data centers. We classified all data centers as being located in one of the eight ERCOT supply regions: Coast, West, East, North Central, South Central, South, Far West, North. We then ascribed a demand for each data center. For a minor fraction of the data centers, this was easy to accomplish, considering that the Data Center Map listed exactly how much load a particular data center consumes. For the remaining data centers, we had to distribute the load between data centers that either listed their square footage or had no such information listed. 87 (24.86%) of the data centers provided exact loads, 60 (17.14%) data centers listed the square footage, and 203 (58.00%) data centers provided no such information. After subtracting the load for all data centers that listed their loads, we distributed the remaining 20.3 GW’s of ERCOT load across data centers with known and unknown square footage. We weighted the load by square footage for the data centers that provided their square footage and spread the remaining load uniformly across the leftover 203 data centers.
The Vatic software takes as input the 2030 grid which contains information about every generator, transmission line, and nodal load in 7,000 locations across the state. Each generator includes information about its startup time as well as fixed and variable costs of production. Each transmission line has a maximum power flow rating. The software also takes in forecast and actual demand as well as forecast and actual production from the solar and wind resources. Using forecasts the system solves a mixed-integer linear program to determine which resources to dispatch at which hours to meet demand at each node throughout the day. We use a 15% reserve requirement to align with ERCOT’s reserve margins. The Vatic software outputs information about the generator dispatch at every location, the power flows through each transmission line, system costs, and a locational marginal price at each of the 7,000 nodes at every hour of every day.
One Year Simulation
We ran Vatic on a full-year simulation using a two-day-ahead forecast. On the following page (opens in new tab), we plotted a few metrics for a representative day from each month.
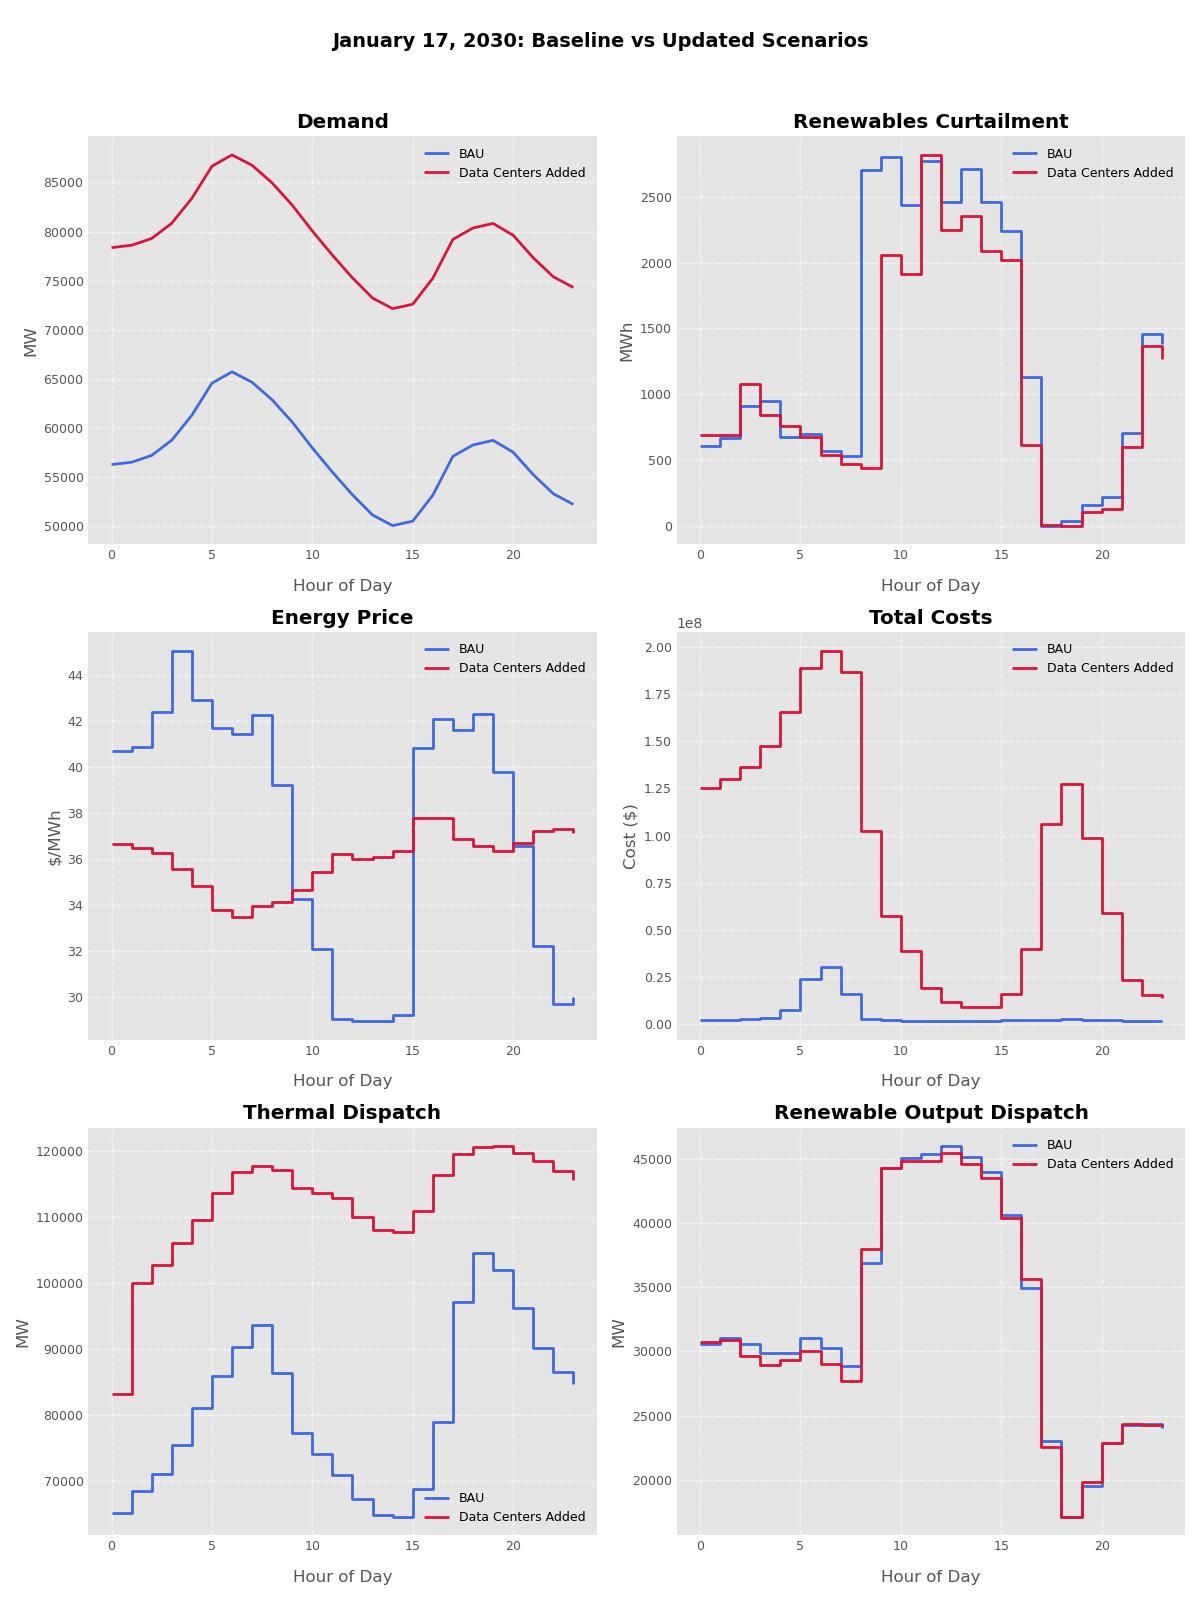
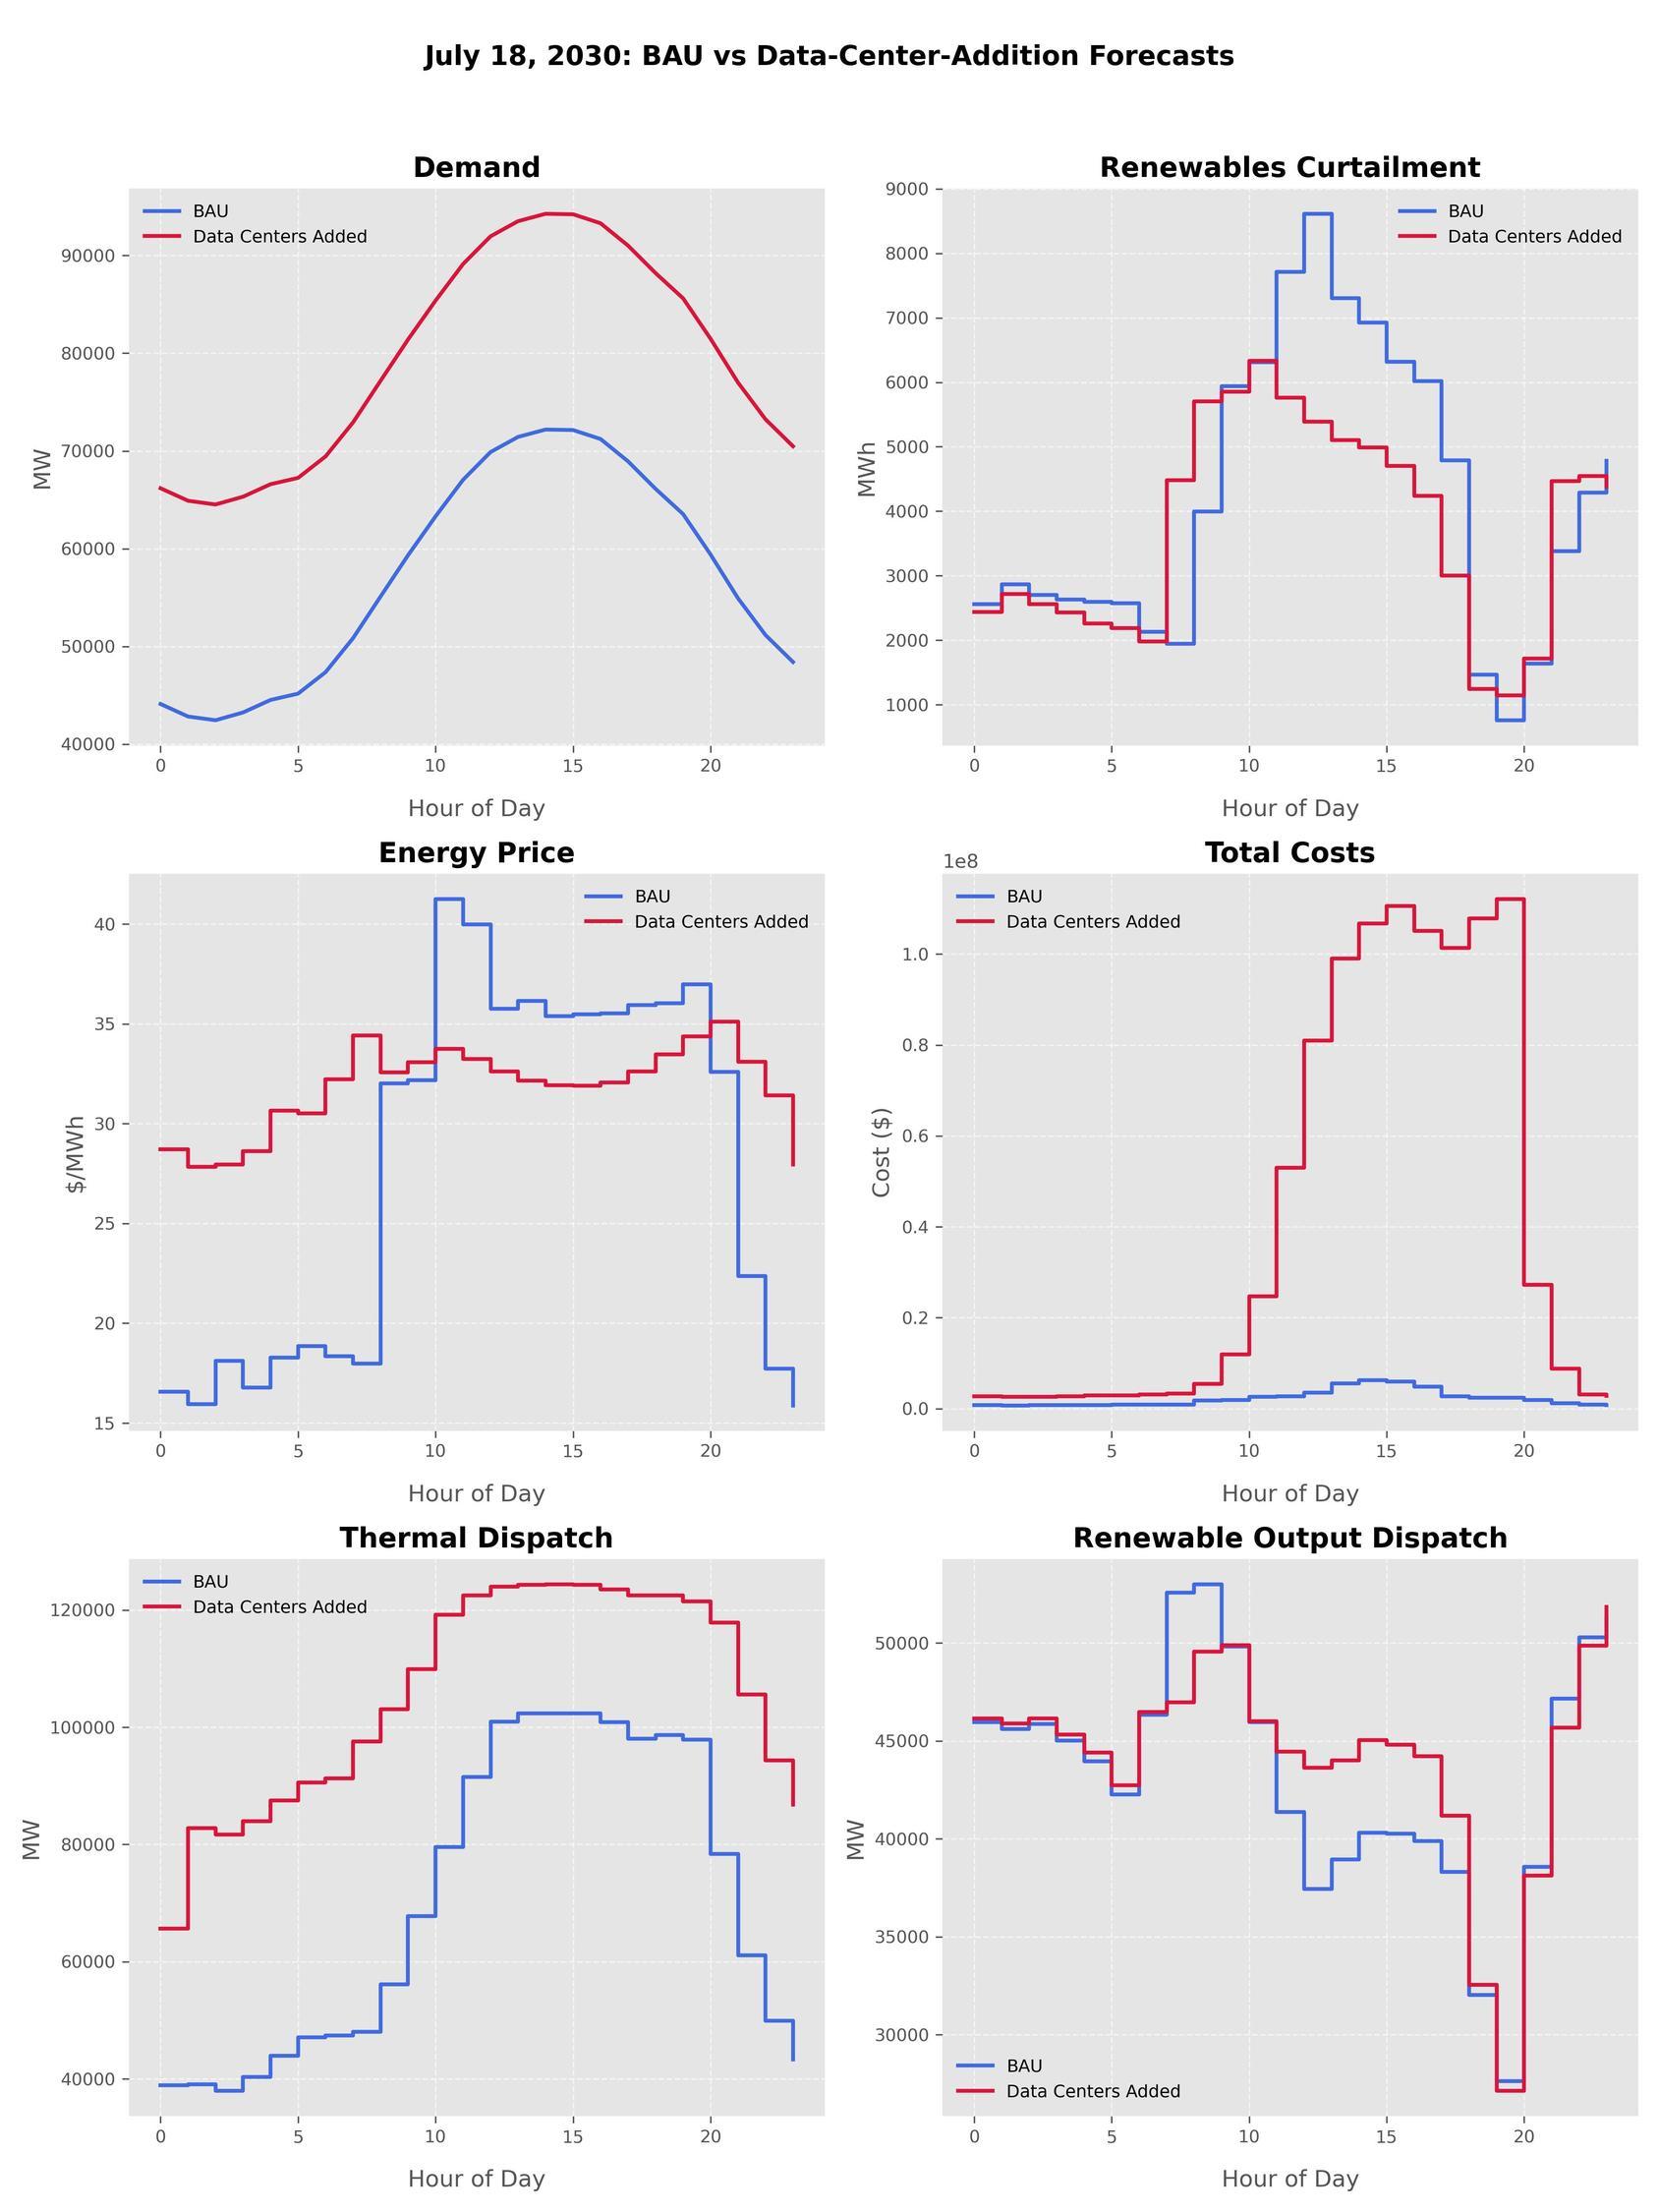
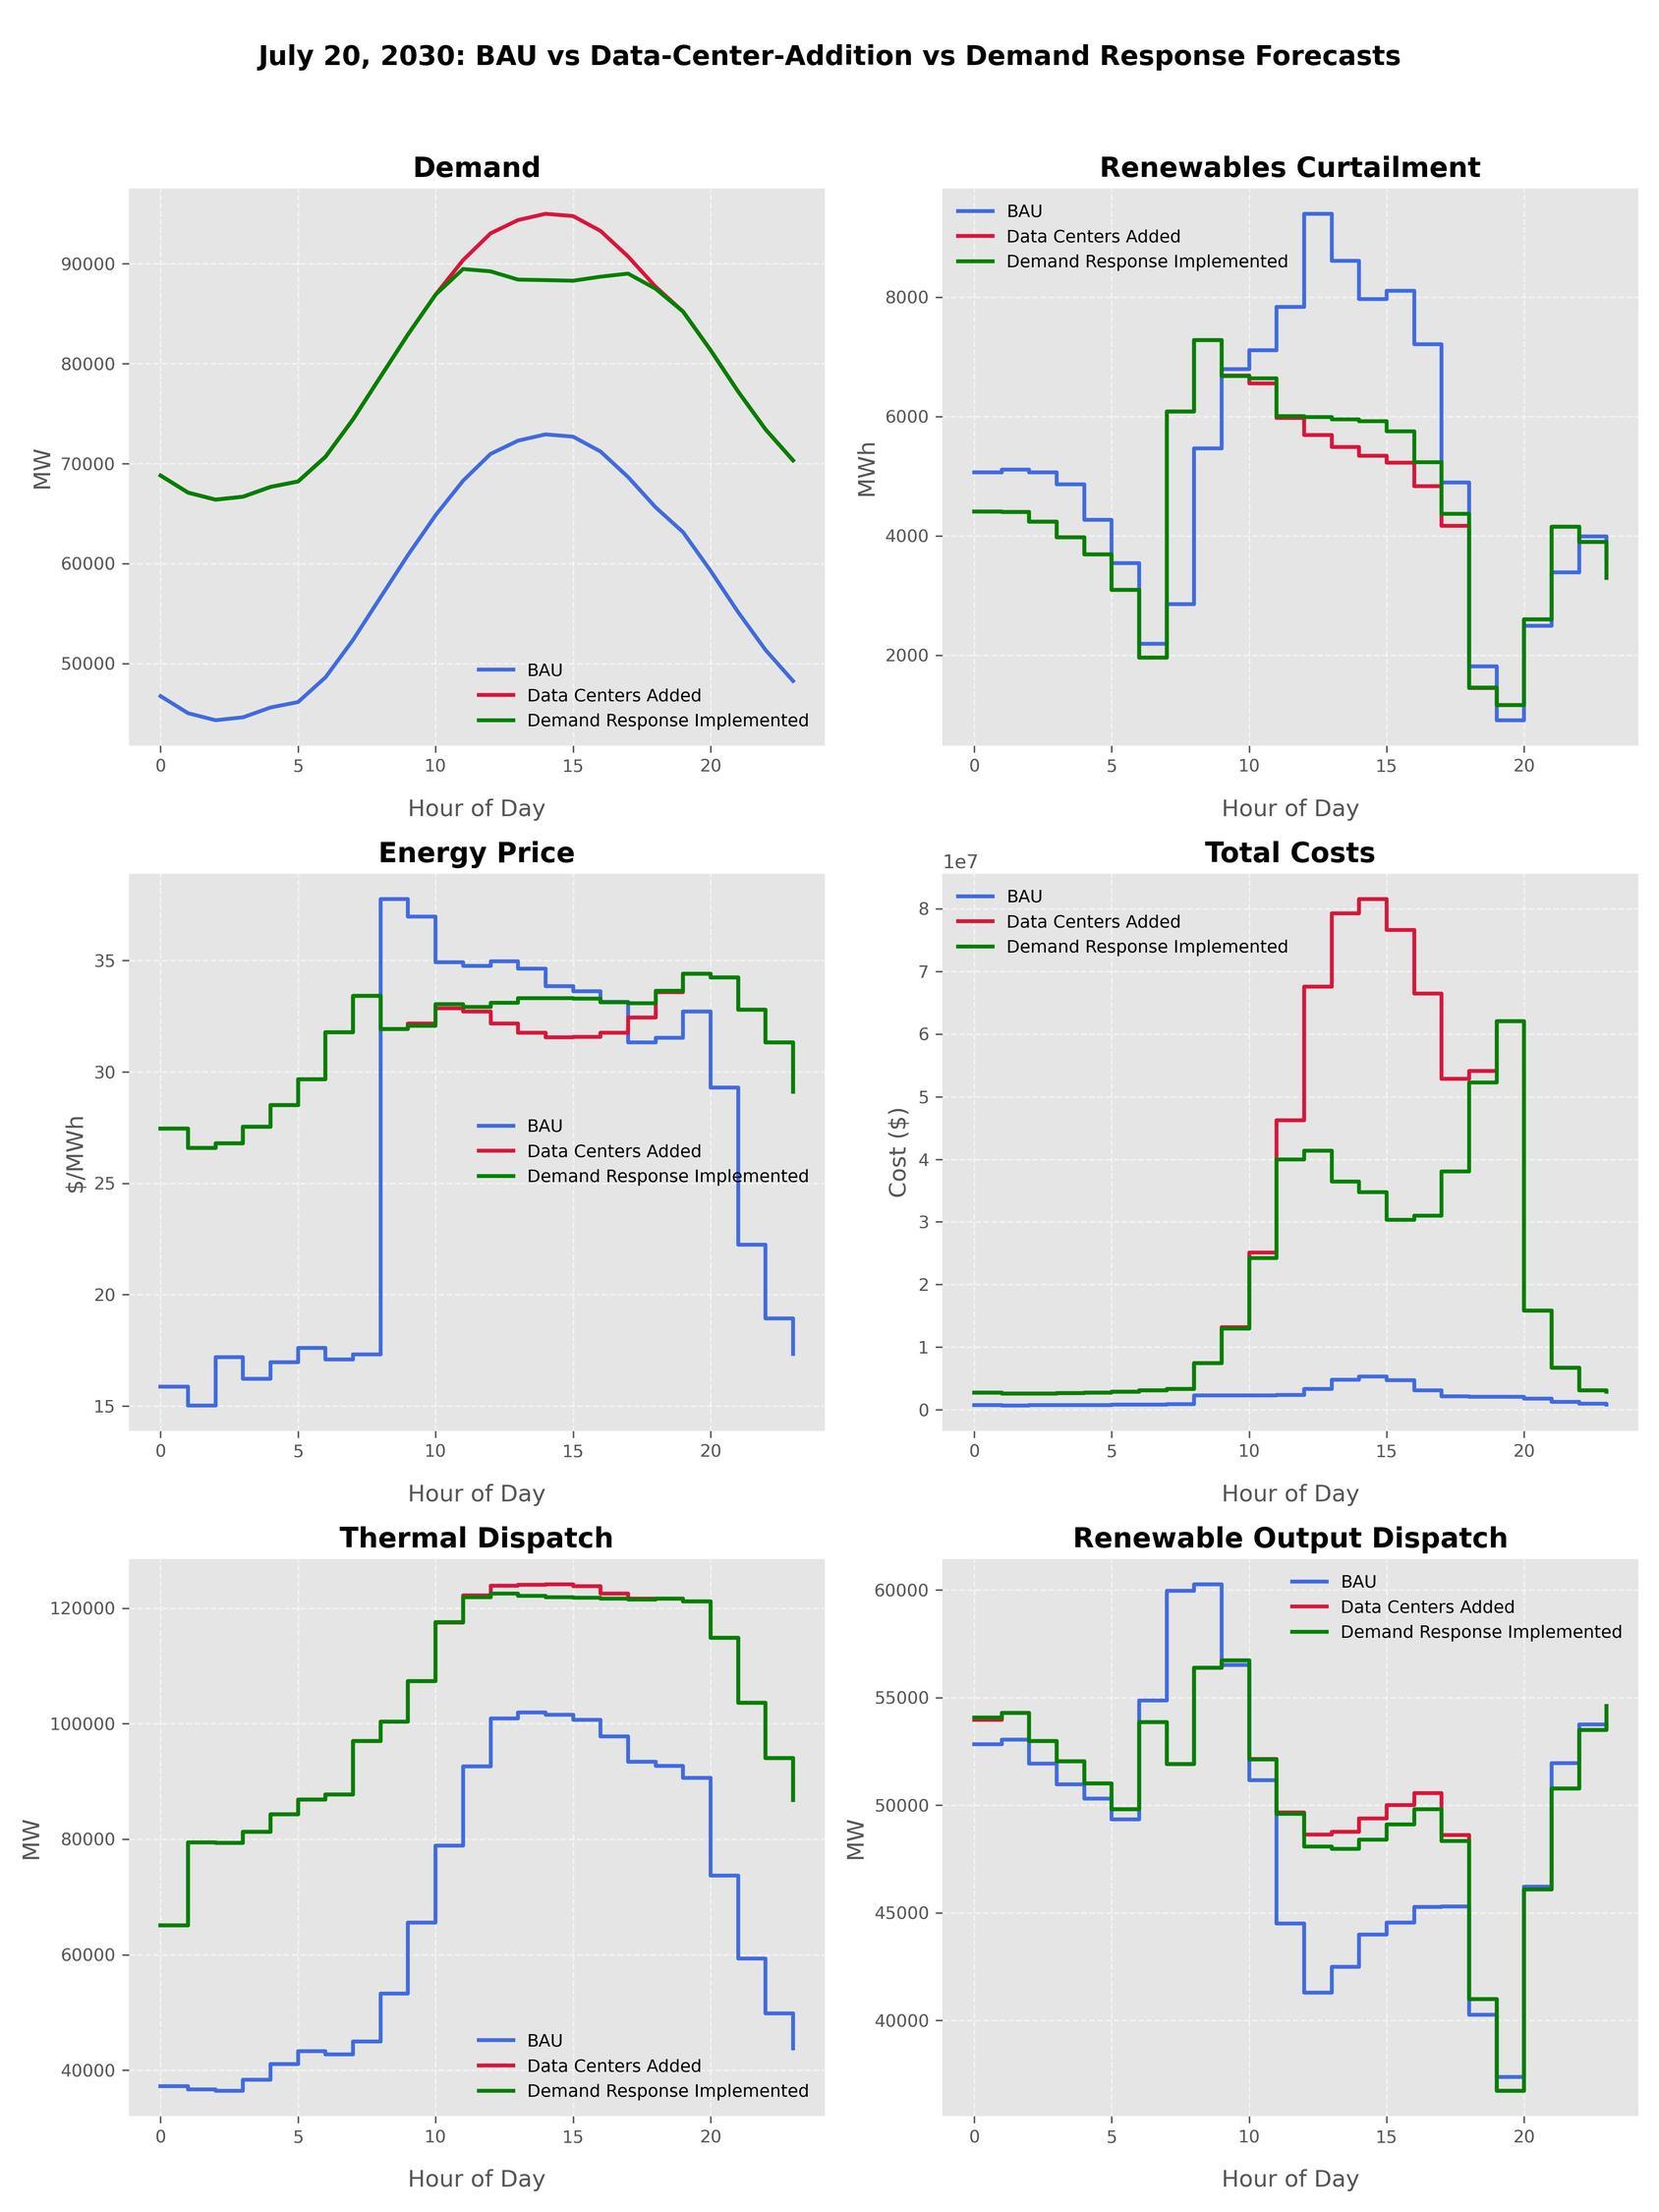
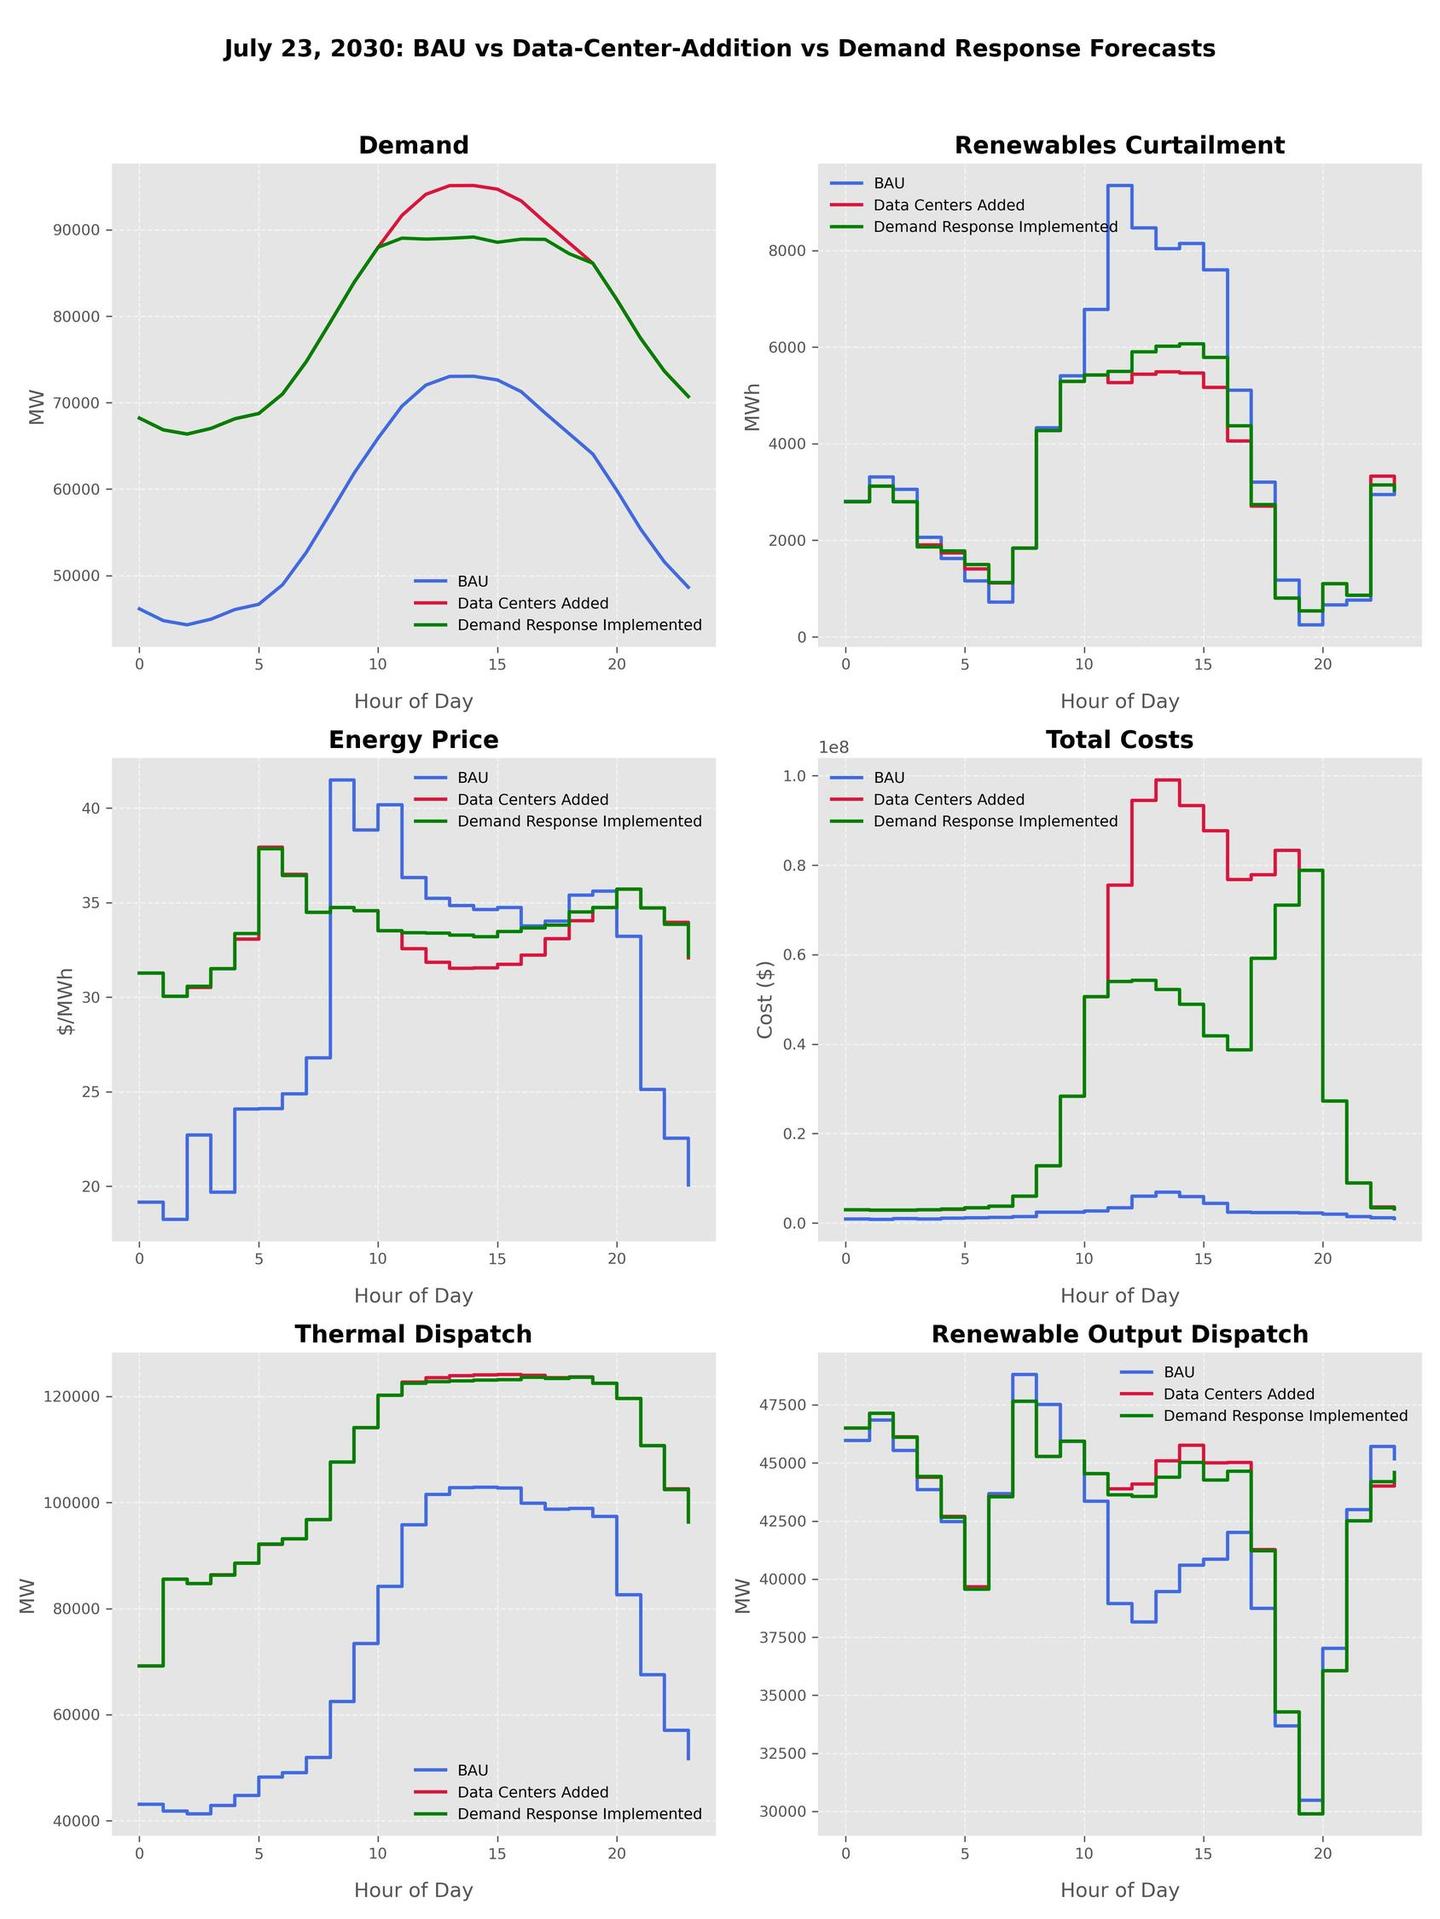
We analyze the output from January 17th and July 18th, as they appeared to be most interesting. For these days, we analyzed six metrics: Demand, Renewables Curtailment, Energy Price, Total Costs, Thermal Dispatch, and Renewable Output Dispatch. We define these quantities as follows:
Total Cost: the sum of Variables and Fixed costs + λ × Load Shedding
- Load Shedding: As described in the “Quantifying Renewables Reliability Risk in Modern and Future Electricity Grids” paper (opens in new tab), represents the amount in MWh from the commitment and dispatch which could not be serviced without out-of-market corrections, and λ is a monetary penalty per unit MWh of load shedding ($/MWh). In our experiments, we take λ = $10K/MWh, which is consistent with ERCOT’s price cap that has recently ranged from $5K/MWh to $9K/MWh.
- Fixed costs: the operational costs of generators that remain constant regardless of the energy consumption.
- Variable costs: the costs that fluctuate based on how much energy is used, including the marginal fuel and start-up costs of dispatched generators.
For each metric, we plotted Business As Usual (BAU) and Data Centers Added data. The former refers to the baseline simulation for the selected day. The latter represents a futuristic simulation with extra 22 GWs of projected data center load added at each hour.
When demand increased uniformly throughout the entire day, so did thermal dispatch and total costs, which remained higher in the Data Centers Added scenario as opposed to BAU scenario for the entire day. Energy price experienced lower variability when data centers were added, with a narrower range than in the BAU scenario. Renewable curtailment varied slightly throughout the day, with the highest differences present in the middle of the day. Renewable output dispatch appeared to have been relatively unaffected.
Similarly to January, July experienced a significantly lower variability and range in energy price in the Data Center Addition scenario as opposed to the BAU scenario, with overall higher prices. Total costs have gone up significantly, driven by the load shedding penalties that were present when the data center load was factored in. Thermal dispatch have also increased throughout the day in the Data Centers Added scenario compared to the BAU scenario.
Without additional supply, data centers could increase electricity prices in Texas by 49% in next five years
Using a synthetic test grid for Texas in 2030, also produced by the group at Texas A&M, which assumes 50% of electricity generation from renewables, we simulated a full year of grid operation. The simulation includes all generation, load, and power flows at each hour of the year. We tested two scenarios: 1.) A baseline case which accounts for the load forecast for Texas in 2030 without data centers, and 2.) A data center case, which adds 22 GW of additional load in the state’s major data centers hotspots, with allocations described in our methodology (opens in new tab) section.
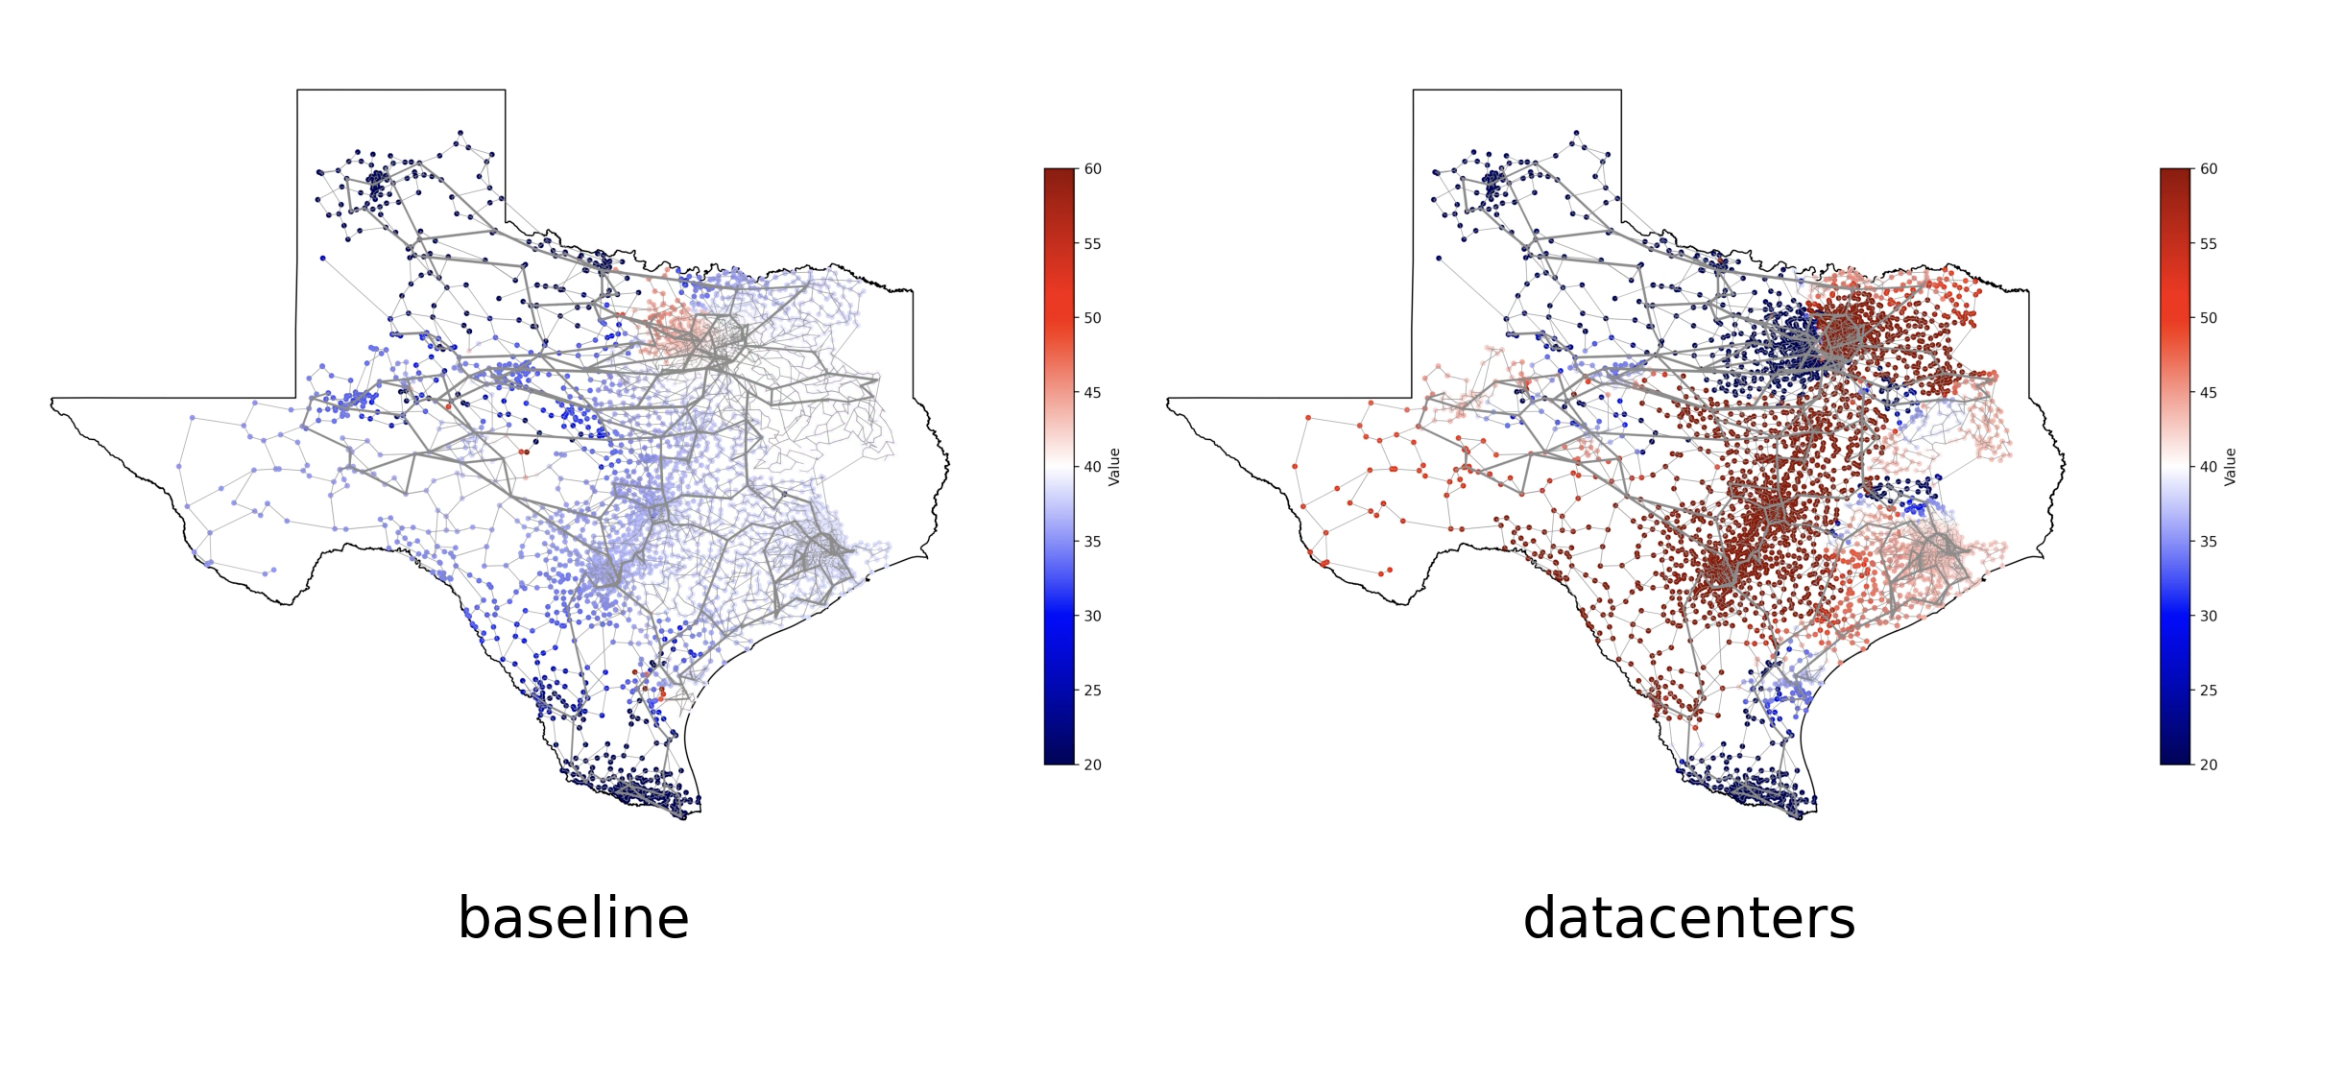
Data centers are typically built near cities, likely for better access to the internet backbone. When studying data center additions, the Vatic software allows us to take into account locational and transmission constraints. High prices often clump together in different sections of the grid.
Higher System costs and reliability risk
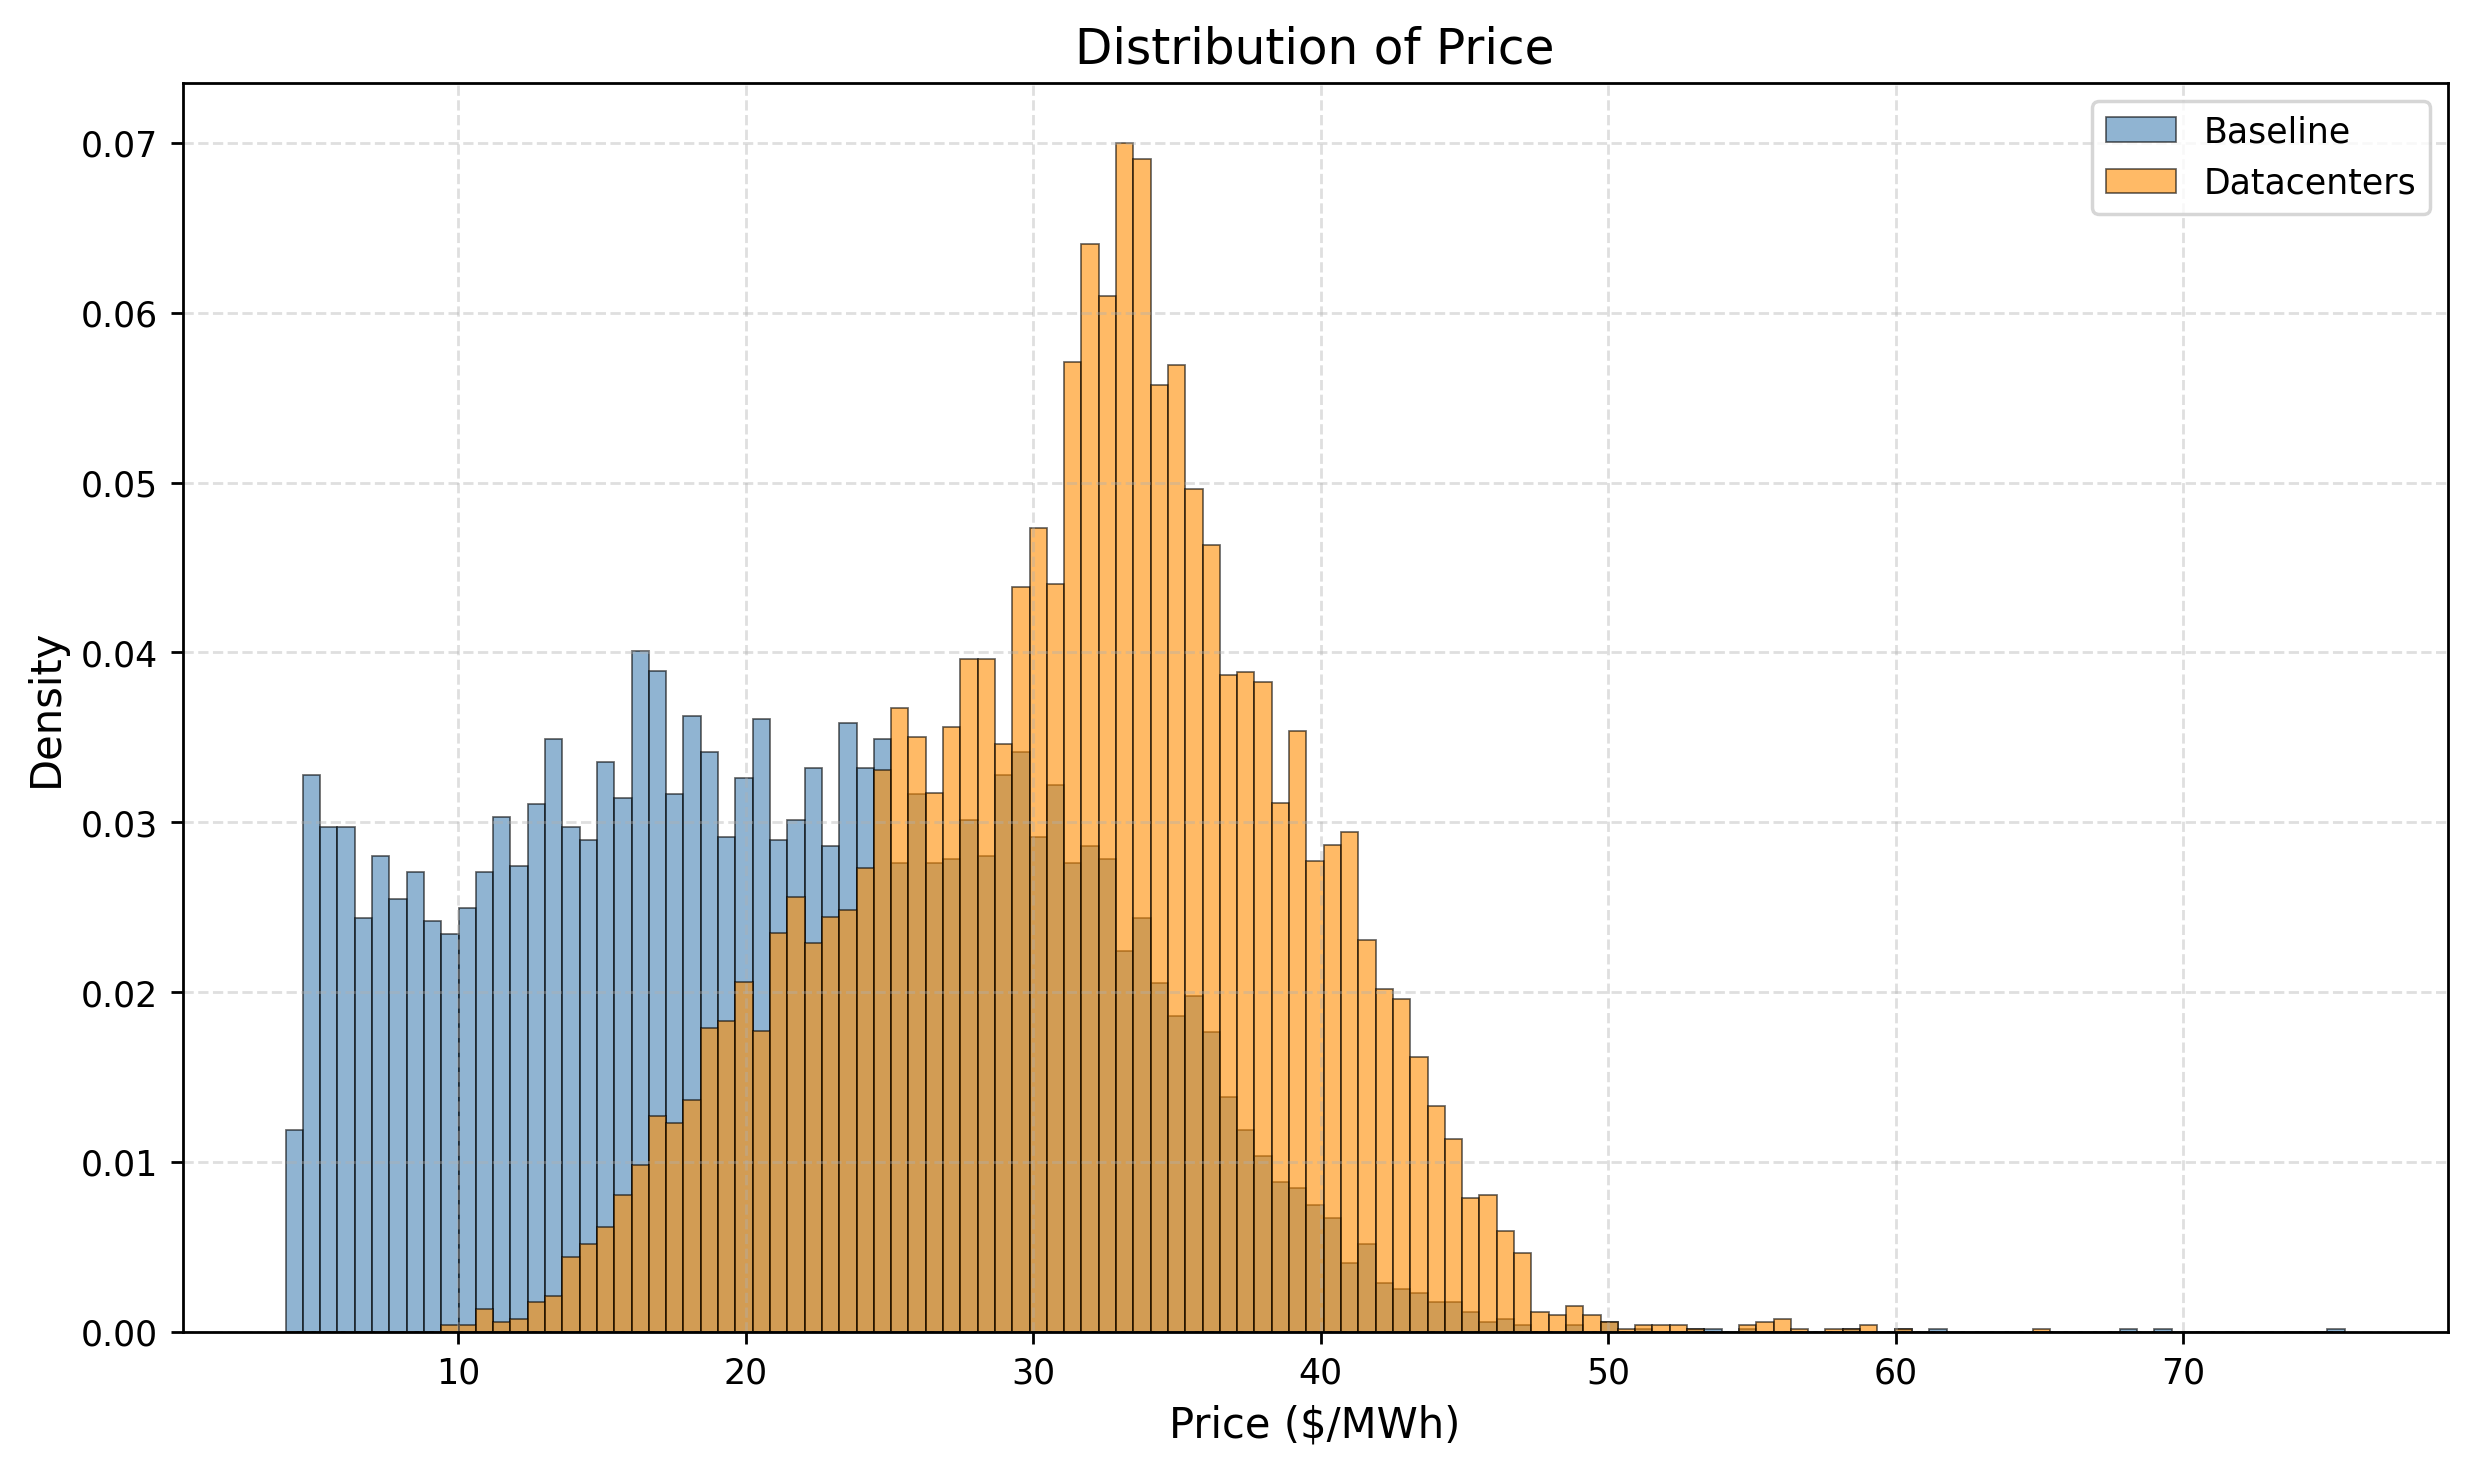
Under the baseline case, wholesale prices averaged $21.18/MWh. When we added 22 GW of data center load, prices rose to an average of $31.47/MWh, a 49% increase on average. The standard deviation of prices decreased from $9.76/MWh to $7.34/MWh. The variance declined because the higher load in the data center case is met by thermal generation (natural gas and coal). By meeting demand with a higher fraction of thermal generation and lower fraction of variable renewable energy, price variation decreases.
In addition to driving up prices, data center additions will increase overall system costs and lead to higher rates of load shedding. Considering the upper-tail conditional value at risk, during the top 5% worst hours costs average $10.7 million in the baseline case and $718.5 million in the data centers cases.
In addition to higher costs, data centers greater increase reliability risk for the grid. Under the baseline scenario, only 4 MW of load was shed on average each hour. With the increased demand from data center, load shedding increased to an average of 724 MW per hour. Load shedding occurs when the cost of supplying an addition megawatt of power at a particular node would exceed $10,000.
Different levels of load
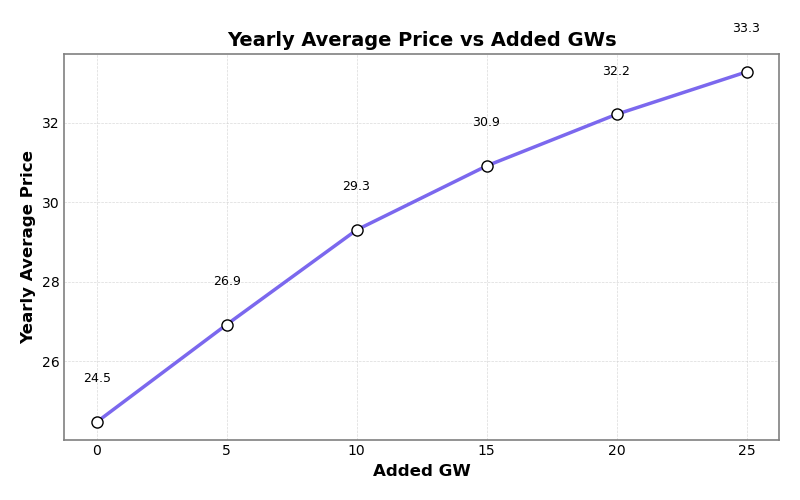
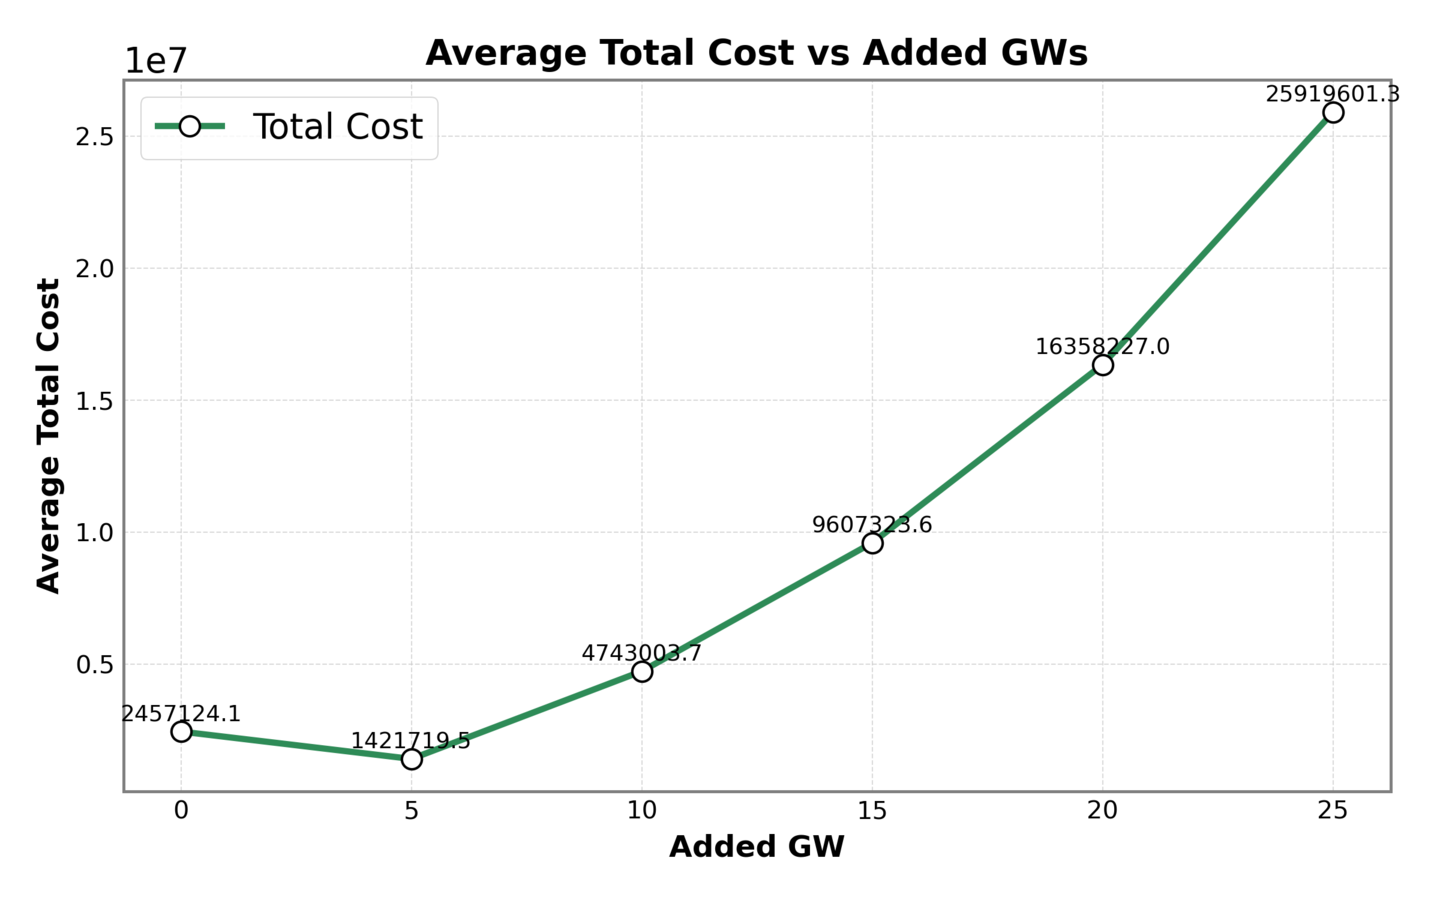
While the Texas grid operator projects 22 GW of additional data center load by 2030, the actual amount is uncertain and will depend of the success of tech companies and AI as well as the ability to interconnect the data centers. Because of this uncertainty, we varied the amount of data center additions from 5 GW to 25 GW to see how different levels of new load impacted the system.
Average price increased as more load was added to the grid. However, with each additional 5 GWs of load, the subsequent increase in price became smaller. This observation is reflected in the graph’s increasing, concave down shape.
Total costs also increased as more load was added to the grid. Surprisingly, when 5 GWs of load were added to the grid, lowest average total costs were obtained. We believe that with a small load addition more thermal generation was used to supply the grid, resulting in less load shedding. Since load shedding is the major driving factor of total costs, a reduction in load shedding resulted in lower average total cost.
Demand response with data centers
Can data centers be used as flexible resources to reduce their impact and support the system?
Background
As we saw in the previous sections, a sudden growth in data center demand without an adequate buildout of supply will dramatically raise prices and system costs. One approach to supporting the grid as demand increases is demand response and load side flexibility. These technologies may play a much larger role for the grid in the future, even leading The Economist to call them “glamorous” (opens in new tab). One form of load-side flexibility is a virtual power plant (VPP). Companies can aggregate and control many smaller distributed resources such as electric vehicles or home heating. They can control these technologies and turn off their load during the hours when electricity supply is tight.
Data centers too may perform demand response. Recent research as part of EPRI’s DCFlex initiative (opens in new tab) in partnership with Nvidia’s Emerald AI has shown (opens in new tab) that software tools can control data center power use during times of peak demand. While the revenue from demand response may not be enough for data centers to participate for economic reasons, it is possible that by being a flexible resource a data center could connect to the grid faster. Data centers are already putting a strain on the grid and raising electricity prices. A report from Monitoring Analytics (PJM’s market monitor) assigned more than $9B of the $14B bill from the 2024 auction to data centers, both in operation and forecasts. As these large loads face more scrutiny for connecting to the grid, their ability to be flexible will be valuable.
Using the Vatic software, we performed simulations with 22 GW of additional load in locations with data centers and allowed the data centers to perform demand response. Additional experiments can be found here (opens in new tab).
Demand response implementation
System load in Vatic is distributed across ERCOT’s eight weather zones. We used the locations of current data centers in Texas as a proxy for the locations of future data centers.
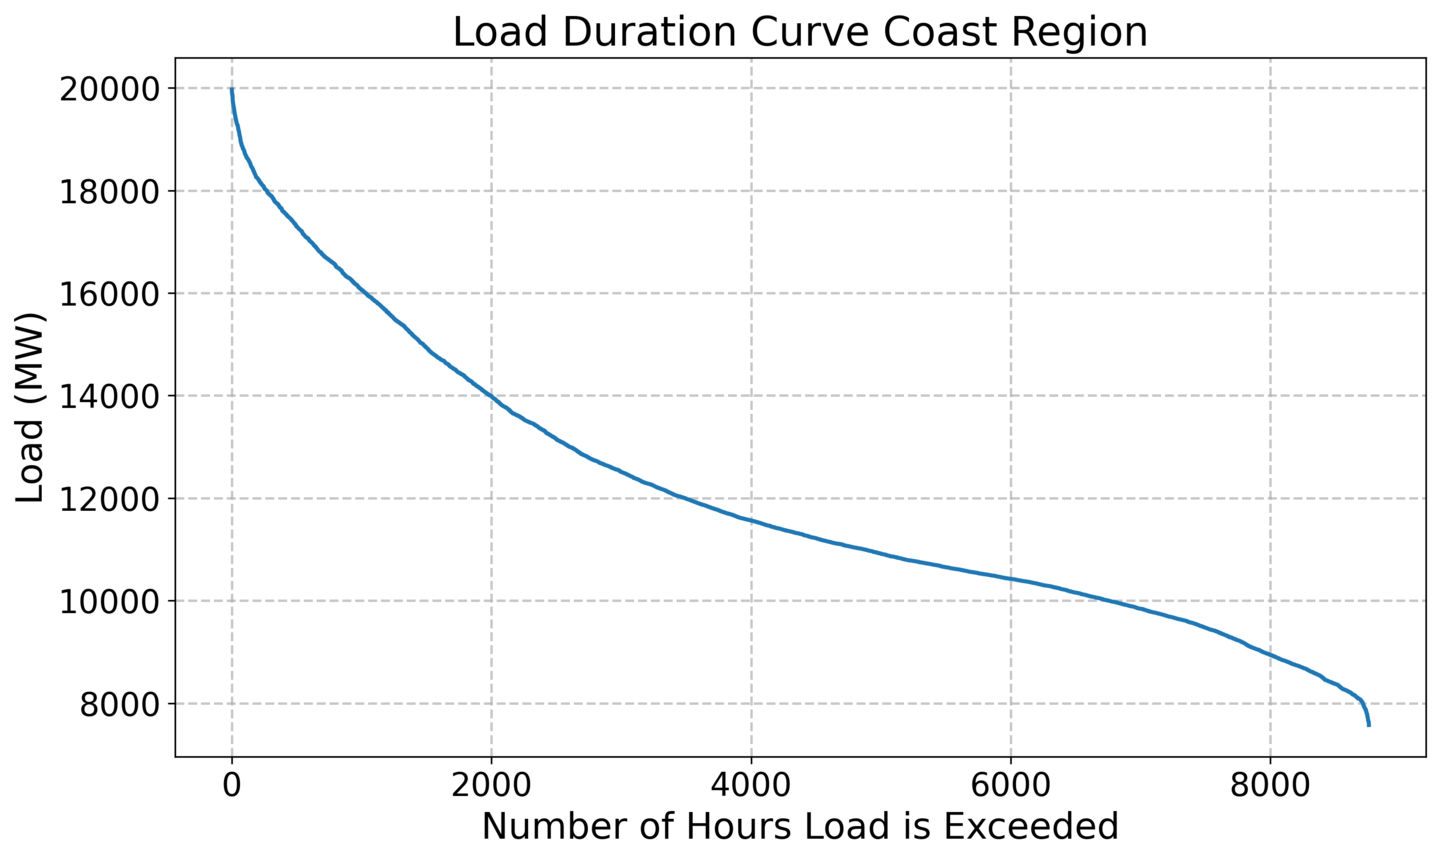
Using forecasted loads, we constructed load duration curves for each zone. A load duration curve depicts the demand at each hour of the year sorted in descending order of demand level.
Next using the allocation of data center load in each region, we calculated how much energy data centers could curtail in each region. Following the estimates provided in Tyler Norris et al.’s “Rethinking Load Growth: Assessing the Potential for Integration of Large Flexible Loads in US Power Systems” study (opens in new tab), we assumed 0.5% curtailment meaning each data center could expect to be offline for 44 hours of the year. Furthermore, we assumed that during periods of curtailment, data centers could reduce their loads by a maximum of 50% of their total load.
On days of forecasted peak demand, we reduced loads up to 0.5% curtailment per data center for the year to create an adjusted load duration curve with curtailment.
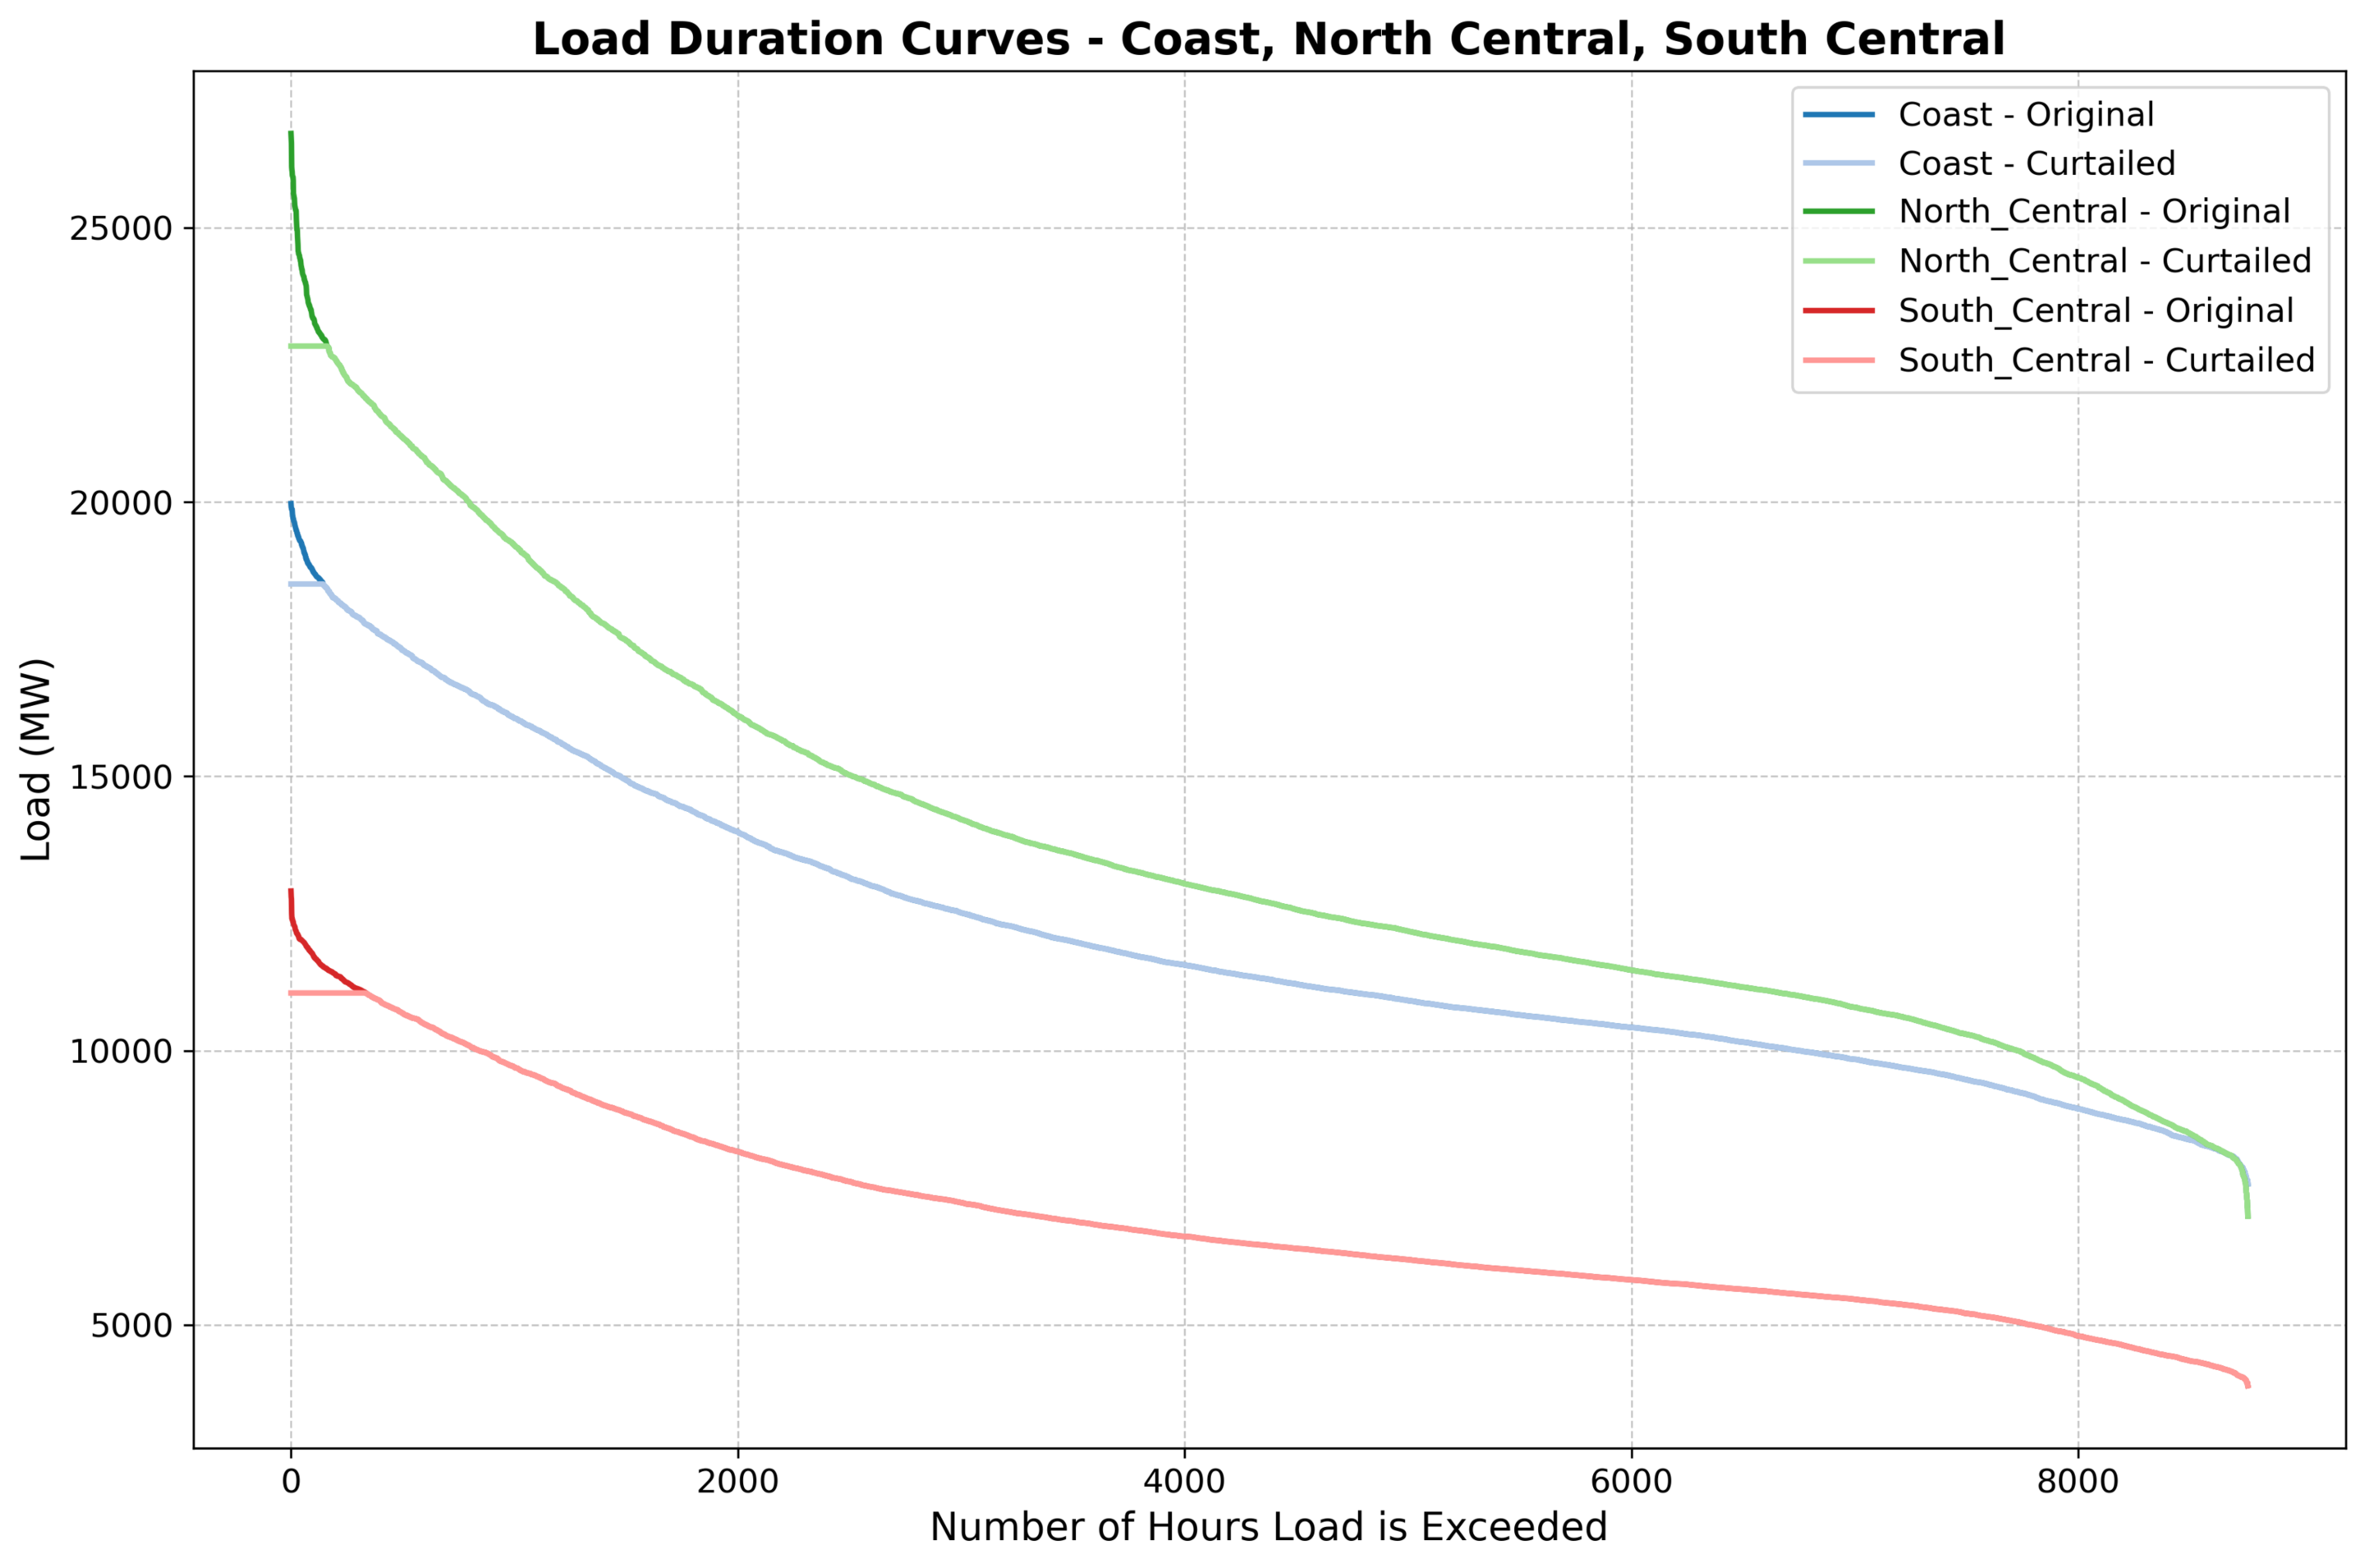
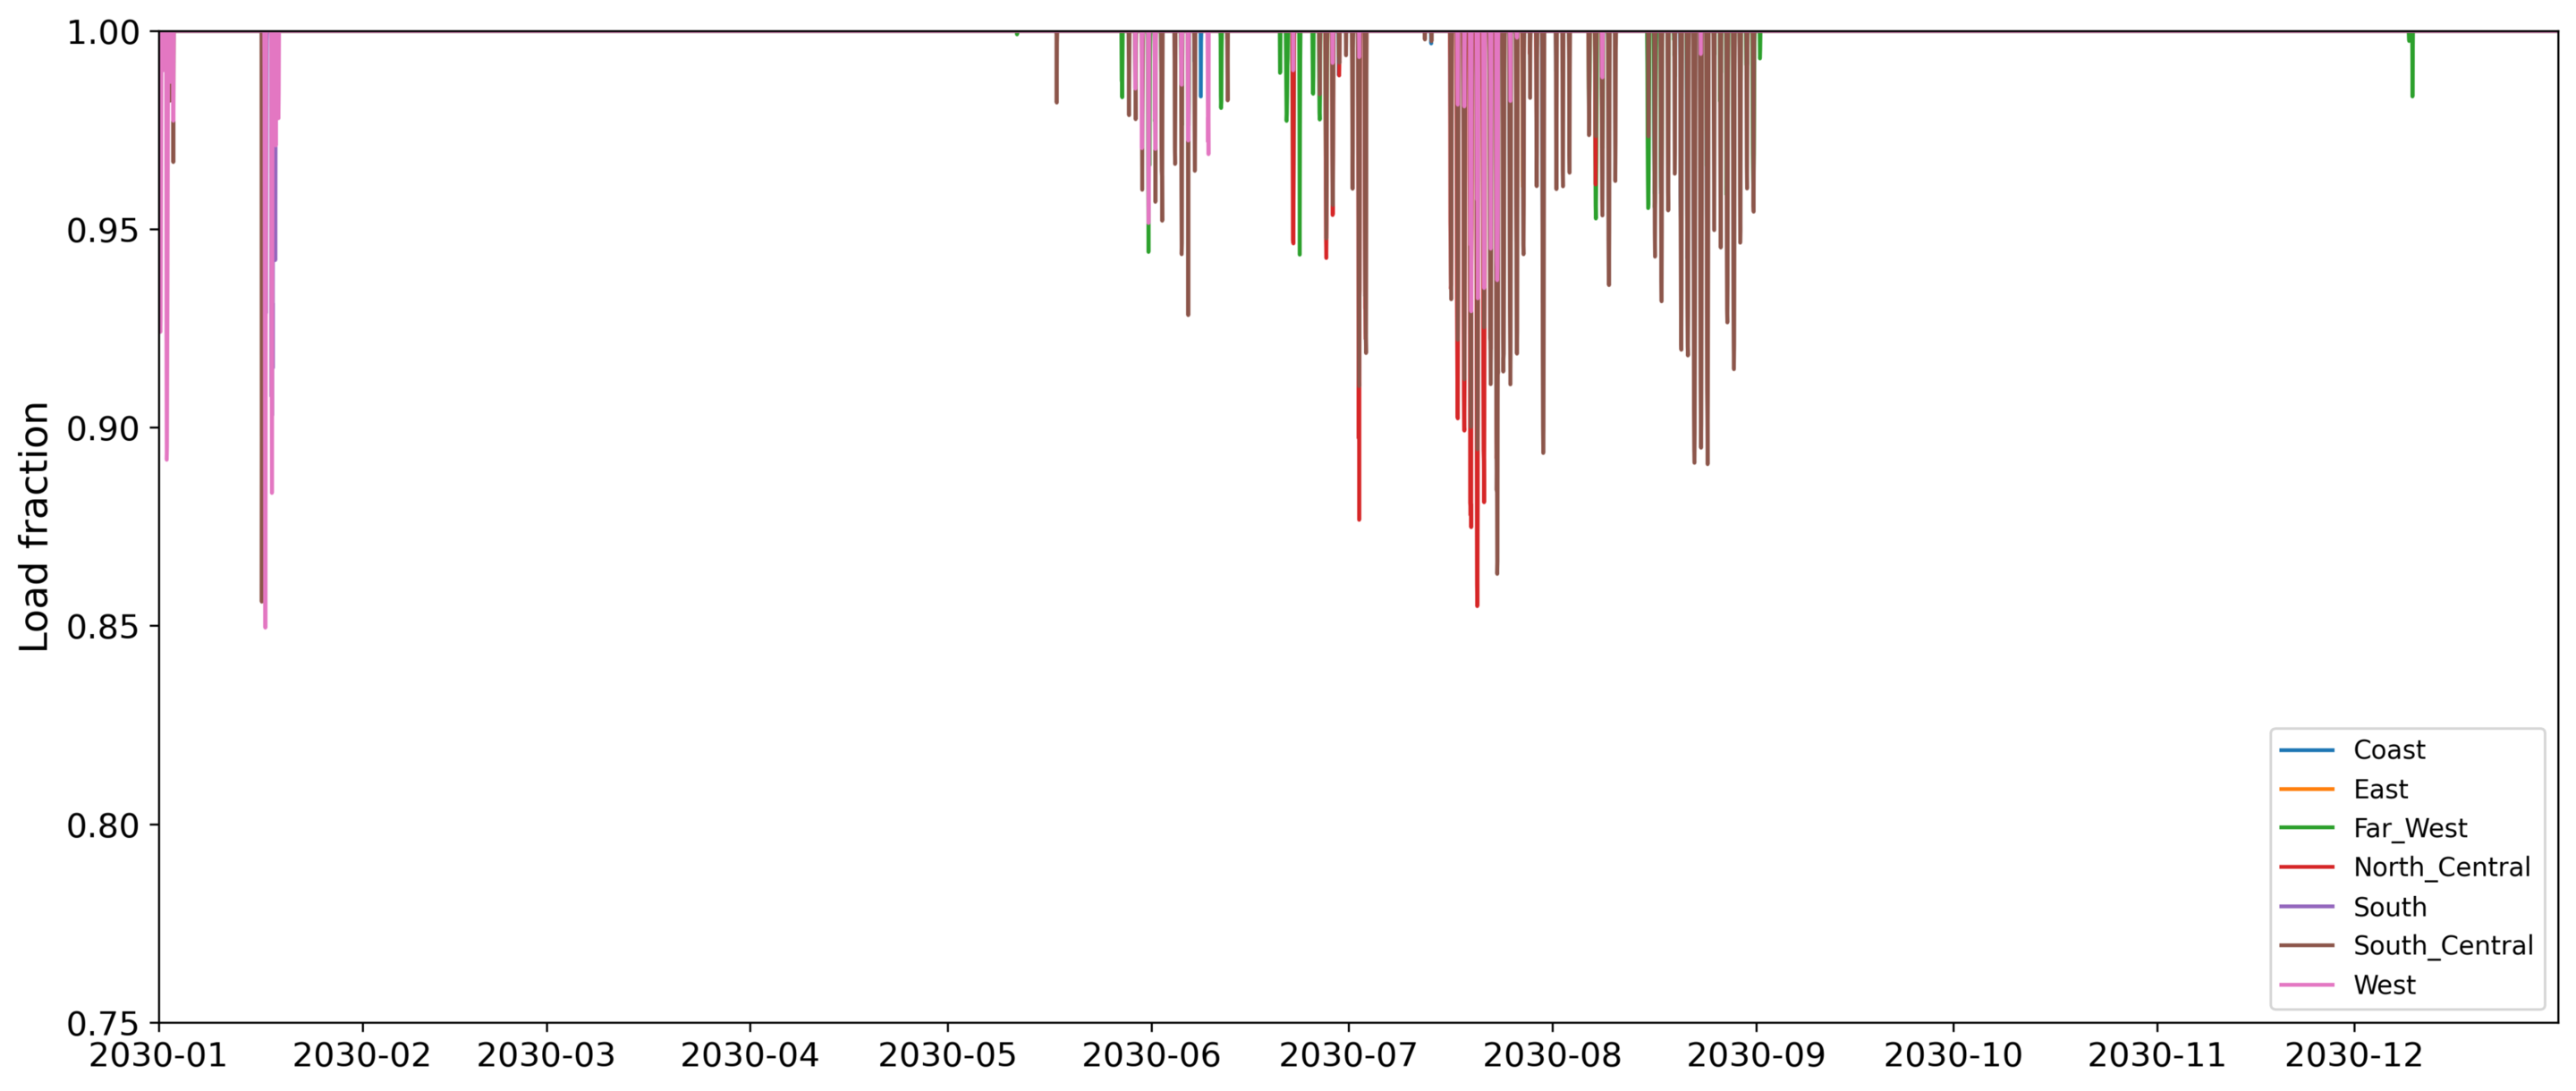
This procedure resulted in demand curtailment for 72 peak demand hours during the year and no curtailment for the remaining hours. From the perspective of the data centers, each individual data center can only be shut off for up to 44 hours (0.5% of the year). Because not all data centers are shut off at the same time, from the perspective of the grid, demand response occurs for 72 hours. Most demand response occurs during summer months when Texas has larger loads from air conditioning.
With data center loads curtailed during peak hours, we re-ran the full year simulation of the Texas 2030 grid.
Findings
First, we demonstrate the effectiveness of demand response on two days in July with unusually high demand peaks. Under our procedure, the demand curtailment is greatest on these peak loads. We observe the following:
- Renewable output dispatch decreased by about 2.3%
- Thermal dispatch decreased by about 8.7%
- Total costs went down by about 57%
- Electricity Price went up by about 5.6%
- Renewables Curtailment increased by about 11%
- Peak demand was reduced by about 7%
Note that, counter-intuitively, prices increase slightly when demand response occurs. This is happening due to the significant reduction to load shedding in the modeling software. With less load shed from the system, we see the prices slightly higher. The load shedding difference is taken into account when calculating total costs.
The full results for 72 demand response hours are provided in table 1 on the following page (opens in new tab).
Conclusion
Data centers, and their electricity demand, will continue to grow rapidly in the coming years. This new demand will strain the electricity grid as it is projected for 2030 if no action is taken to meet the significant load increase. Tools like demand response can be effective in managing the grid during the hours that matter most, referred to as peak hours, when demand is at its highest. However, the hours when demand response can be deployed represent only a minor fraction of the entire year, less than 1%. To effectively manage forthcoming demand increases, grid operators and other stakeholders will need to adapt practices that can reduce the strain inflicted by data center expansion when demand response is not available. Some of these practices include expanding transmission capacity, especially of renewable resources, and expanding digital control infrastructure, deploying control systems that can effectively and promptly manage loads.